
🎯 The Business Task (Situation)
As a Junior Data Analyst, I was tasked by Lily Moreno (Director of Marketing) to answer a critical business question: How do annual members and casual riders use Cyclistic bikes differently? The goal was to identify behavioral “hooks” that could be used to convert high-value casual riders into profitable annual members.
📐 Technical Architecture & Logic Mapping
Before entering the BigQuery environment, I designed a technical blueprint to ensure data integrity across the 1.9M row dataset. This “Systems Engineering” approach allowed me to map the flow from raw source files to final executive insights, establishing the “Quality Gates” necessary for a high-precision analysis.
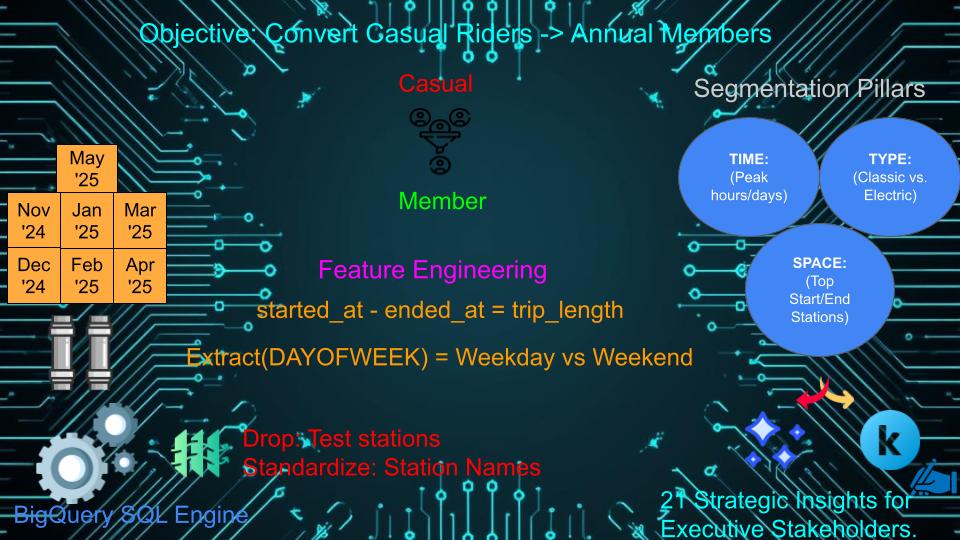
Figure 1: Project Logic Map — Visualizing the ETL process, cleaning parameters, and the 3-pillar analysis strategy used to derive business value.
🛠 The Action: Engineering-Grade Data Processing
In engineering, a system’s output is only as reliable as its input. I treated the 1.97M+ unique records (November 2024 – May 2025) as a fluid system where “flow” represents user movement.
1. Data Source & Decision Logic
- Infrastructure: I utilized BigQuery for extraction and transformation because standard tools like Google Sheet reach “failure point” at this scale (1.9M raw records).
- Source: Publicly available 7-month trip data provided by Motivate International Inc.
2. Transformation Rigor (The “Cleaning” Protocol)
- Standardization: Implemented
TRIM()functions across station columns to eliminate string noise. - Handling Nulls: Replaced missing start/end station IDs (approx. 18.4% and 19.2% of fields) with the value
'unknown'usingIFNULL(). This preserved total ride volume for high-level metrics while allowing for filtered station-specific deep dives. - Calculated Safety Factors: Used
TIMESTAMP_DIFFto createtrip_duration_secand utilizedLEAST()/GREATEST()logic to ensure all temporal durations were non-negative and physically possible.
💡 Key Findings: The 21-Insight Breakdown
My analysis uncovered 21 distinct strategic insights, categorized into three “Operational Pillars”:
Pillar 1: Temporal Habits (When they ride)
- Commuter Utility: Members consistently peak during mid-week mornings and evenings, suggesting a high reliance on Cyclistic for the “Workplace-Home” corridor.
- Weekend Leisure: Casual riders peak on Saturdays, with their usage volume surging by nearly 40% compared to their weekday baseline.
Pillar 2: Ride Characteristics (How they ride)
- The Duration Gap: Casual riders maintain significantly longer “Time-on-Bike” (avg. trips often exceeding 1,200s) compared to the efficient, shorter bursts of members.
- Asset Preference: Casual riders show a higher propensity for Classic Bikes, especially for leisure-oriented trips.
Pillar 3: Geographic Concentration (Where they ride)
- Recreational Hubs: Casual rides are heavily centered around recreational areas (e.g., DuSable Lake Shore Dr & Monroe St), while members are concentrated in educational and business districts.
📊 Visualized Demand Patterns
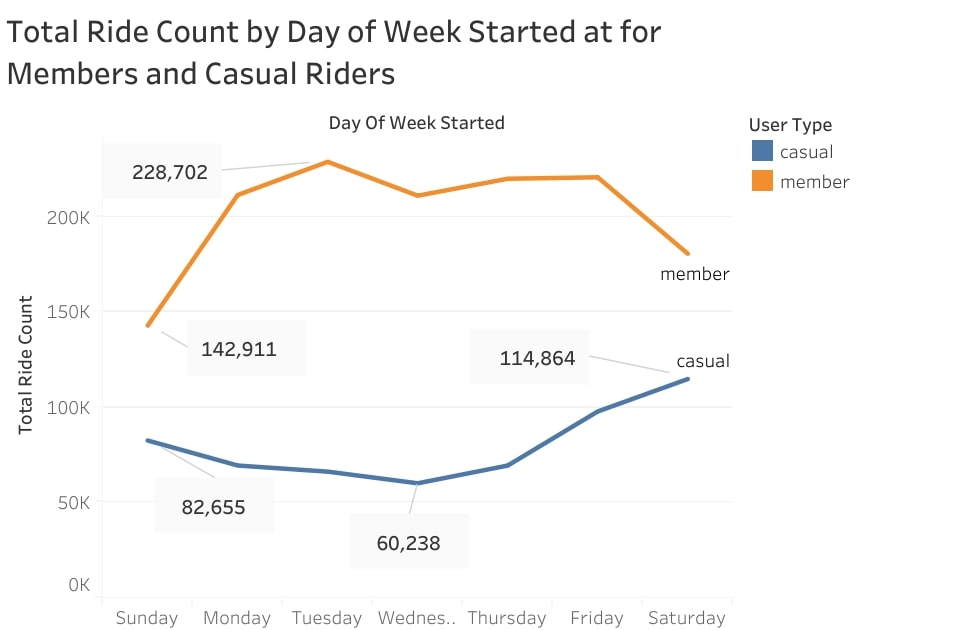
Figure 2: Comparative analysis of ridership volume, highlighting the strategic 40% surge in casual riders during weekend intervals.
This visualization highlights the ‘Weekend Cross-over’—the strategic window where casual ridership volume provides the highest conversion opportunity.
🚀 Strategic Recommendations
Based on the 21-point analysis, I proposed three long-term actions:
- Seasonal Spring Campaigns: Partner with parks, museums, and tourism boards to promote memberships at high-traffic casual corridors during peak May surges.
- The “Ride Streak” Mechanic: Introduce gamified rewards for casual riders who hit frequent usage milestones, building brand attachment before the membership pitch.
- Tiered Membership Options: Explore a “Weekend-Only” annual pass to capture the high-volume leisure segment.
📂 Technical Verification
| Resource | Access Link |
|---|---|
| GitHub Repository | View Technical SQL & Code |
| Kaggle Notebook | View Interactive Analysis |
| Tableau Dashboard | View Executive Visuals |